Geospatial Modeling for Emergency Management:
Risk, Accessibility, and Community Resilience in Coastal Connecticut

Abstract
This project employs geospatial modeling to evaluate the storm surge impacts of three historical hurricanes, as well as a projected future storm, on Connecticut’s coastal communities. The events examined include the Great New England Hurricane of 1938, Hurricane Irene (2011), Hurricane Sandy (2012), and a future hypothetical storm scenario anticipated for 2035. Using publicly available data and GIS tools, I overlaid historical and potential future storm surges with critical infrastructure, commercial zones, and population density to quantify past and future risk exposure. Network analysis was applied to evaluate the spatial accessibility and coverage of designated emergency shelters and evacuation routes. The project integrates an interactive, story-based mapping component to visualize historical evacuation patterns and shelter responses, highlighting areas for potential policy improvement. In addition to spatial analysis, the project explores opportunities for public engagement by considering a survey feature to gather community input on past shelter experiences and accessibility challenges. The final deliverable aims to inform local emergency management strategies, enhance community preparedness, and contribute to ongoing policy discussions surrounding coastal resilience.

Public Engagement Strategy and Survey Design
A conceptual website layout was developed as part of this project to demonstrate how storm surge data and shelter information could be communicated to the public through an online platform. The following screenshots illustrate the proposed design.
Figure A. Conceptual website infographic outlining historical and future hurricane impacts, storm surge data, and community preparedness themes for Connecticut’s coastal communities.
While the primary focus of this project was spatial analysis, the development of a conceptual website and outreach materials demonstrates the importance of clear, accessible communication in emergency preparedness. Engaging the public with visual tools such as interactive maps, infographics, and timelines can help build awareness, foster community resilience, and support informed decision-making before, during, and after coastal storm events. Future work could expand on this by incorporating real-time data, user-submitted feedback, and survey responses to better understand community needs and improve response planning.
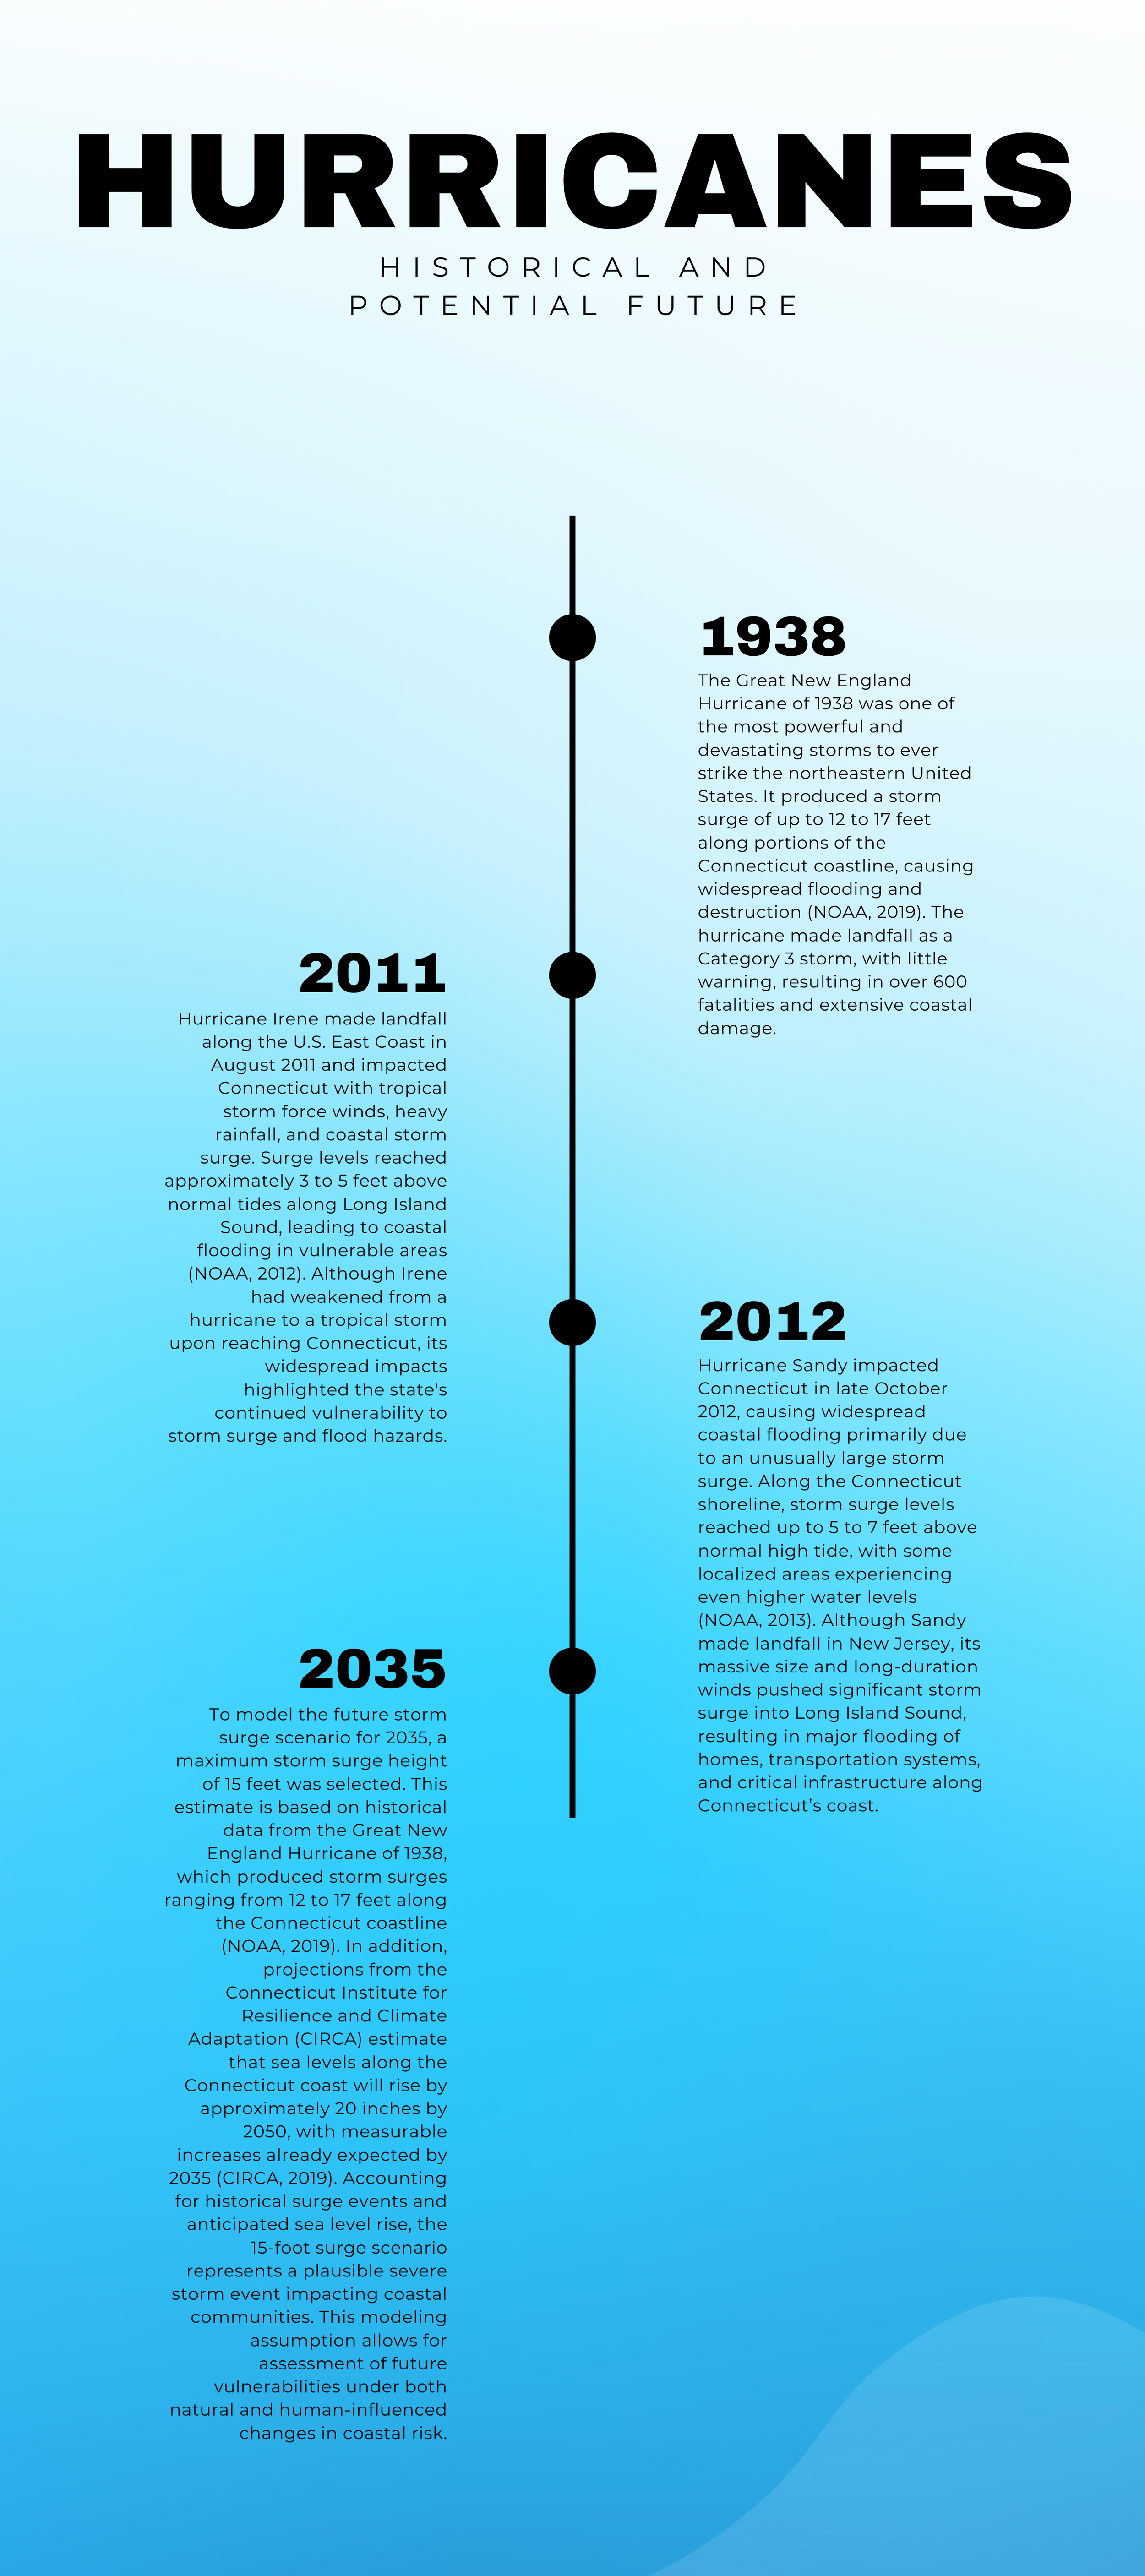
Figure B. Informational timeline graphic designed to communicate key hurricane events and a modeled future storm scenario, providing context for public education and resilience planning.

Figure C. High-risk areas identified where storm surge exposure, high social vulnerability, and shelter locations intersect, indicating priority zones for emergency planning.

Results
Surge Impact Maps and Risk Zones
The storm surge modeling revealed varying levels of coastal flooding risk across southeastern Connecticut depending on the event. The Great New England Hurricane of 1938 and the projected 2035 storm scenario, Future Big Storm (Scenario, 2035) produced the largest inundation extents, with significant inland flooding along the Thames, Niantic, and Connecticut River areas. Hurricane Sandy’s surge showed extensive coastal flooding, while Hurricane Irene’s impacts were more limited in surge extent but still affected vulnerable communities. Areas near river mouths and low-lying coastal neighborhoods consistently appeared at high risk across all scenarios (Figure D).
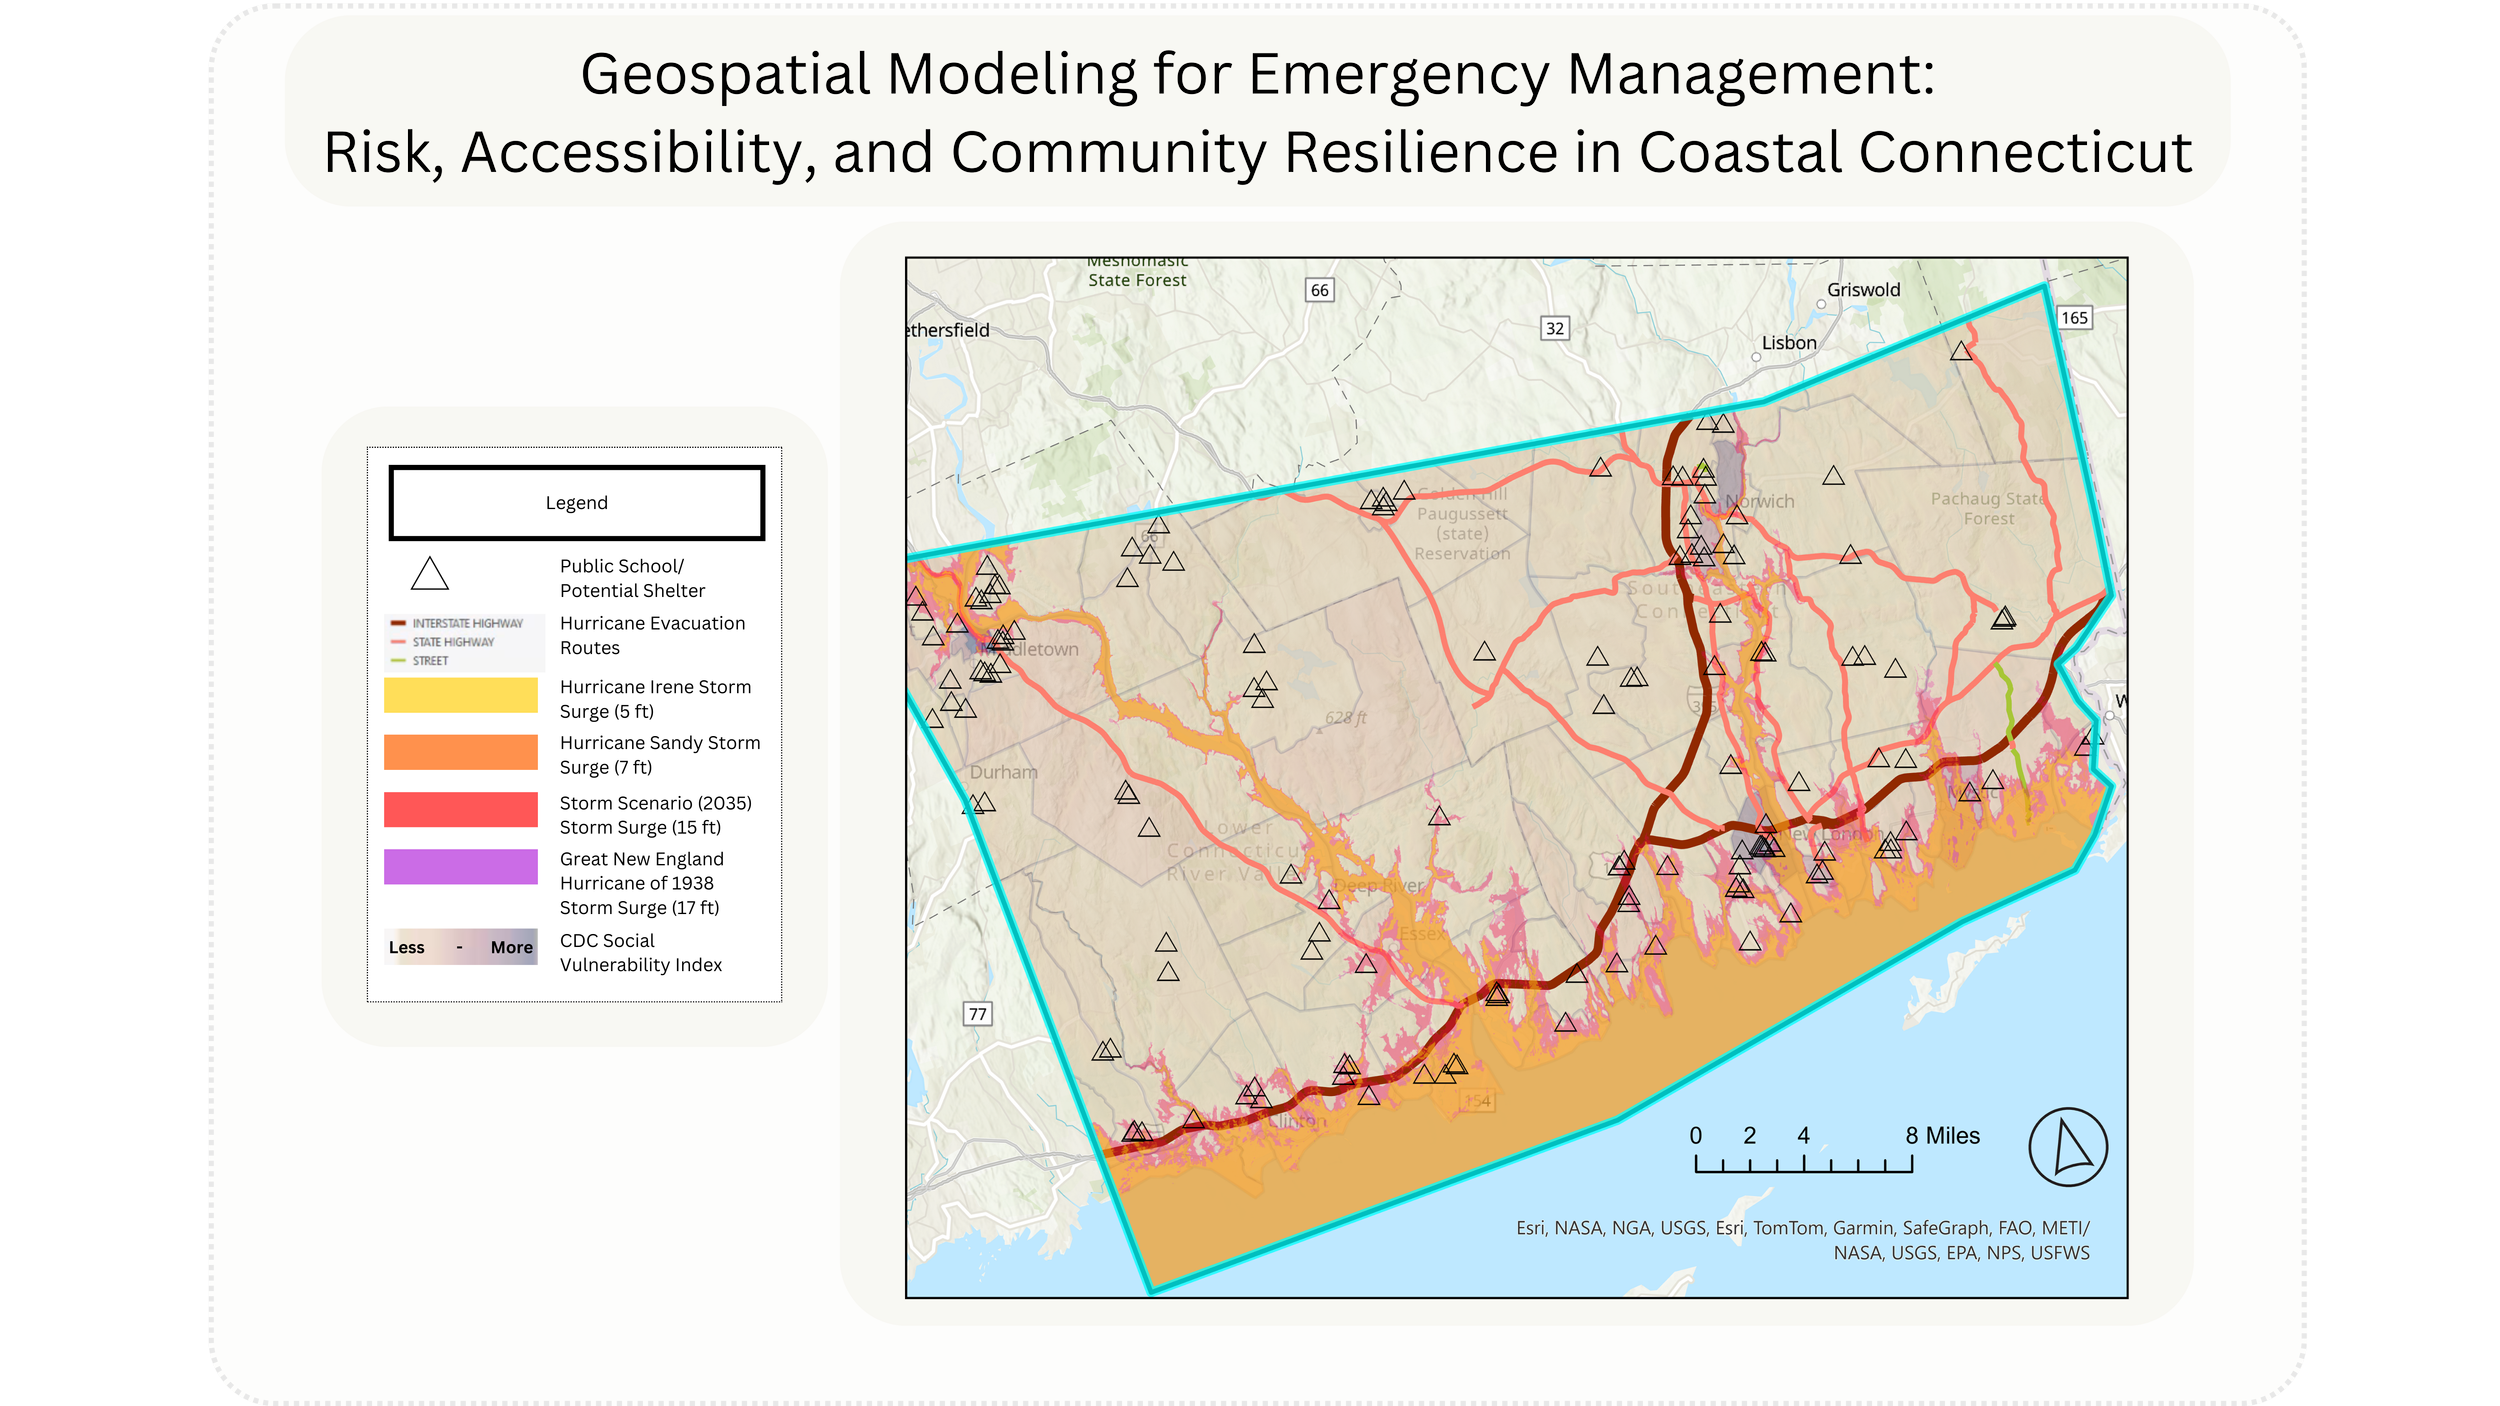
Figure D. Final map displaying all storm surge layers, vulnerability data, evacuation routes, and public school shelter proxies. School symbology was changed from red flags on white circles to hollow black-outlined triangles to improve map readability and reduce visual interference with town names and other key features. A scale bar and north arrow were added to enhance spatial interpretation and map orientation.
Shelter Accessibility Outputs
The geocoded public school locations provided a useful approximation of shelter distribution in the study area. While many inland shelters appeared to be safely outside major surge zones, several coastal school locations, particularly in Groton, New London, and Mystic, fell within projected storm surge areas. These overlaps highlight potential concerns about shelter safety and access in vulnerable coastal regions.
Identified Gaps and Areas of Concern
When storm surge, social vulnerability, evacuation infrastructure, and shelter proxies were viewed together, several communities stood out as having compounded risks. Coastal areas such as Groton, Mystic, and New London showed high social vulnerability, exposure to multiple storm scenarios, and questionable shelter accessibility. Inland communities like Middletown and Norwich also revealed localized vulnerabilities. These spatial gaps suggest the need for town-specific planning strategies that address both physical flood risk and social capacity to respond.
Discussion
Interpretation of Findings
In addition to modeling storm surge impacts, this project incorporated layers representing social vulnerability and evacuation infrastructure to provide a more complete understanding of coastal risk in southeastern Connecticut. The CDC Social Vulnerability Index (SVI) revealed that many high-surge areas, particularly near the Thames, Niantic, and Connecticut Rivers, also contain populations with limited transportation access, economic disadvantage, or higher health-related risks. Overlaying the hurricane evacuation routes allowed for a visual evaluation of how well existing infrastructure serves these communities, identifying corridors where flood exposure could hinder safe evacuation. Although shelter location data was not publicly available, geocoded public school locations were used as proxies, reflecting their common use as shelters across the state. This substitution enabled a visual assessment of shelter coverage, including areas where schools are located within or near storm surge zones.
The storm surge modeling showed that the Great New England Hurricane of 1938 and the Future Big Storm (Scenario, 2035) produced the largest flood extents, threatening densely populated and vulnerable inland-coastal areas. While the 2011 and 2012 storms had smaller surge footprints, their overlap with SVI-designated areas highlights ongoing exposure risks. Localized analysis of towns such as Middletown, Groton, Mystic, and Norwich illustrated how storm surge, vulnerability, and shelter access converge in different ways, reinforcing the need for community-specific emergency planning. These findings underscore the importance of proactive, spatially informed decision-making to address gaps in shelter access, infrastructure resilience, and equitable disaster response.
Policy Implications
The findings from this project can inform state and municipal emergency management strategies by identifying communities where storm surge risk, high social vulnerability, and limited shelter access intersect. Local officials and planners can use this information to prioritize investments in shelter infrastructure, refine evacuation routes, and tailor outreach efforts to at-risk populations. The integration of spatial analysis with public communication tools also supports more transparent and responsive emergency planning.
Limitations and Future Research
This project was limited by the lack of accessible statewide shelter data and the need to use public school locations as proxies. Additionally, storm surge extents were modeled using static elevation thresholds rather than dynamic coastal flood simulations. Future research could incorporate real-time hydrodynamic modeling, community survey data, and mobile-friendly public engagement platforms to enhance the accuracy, accessibility, and impact of coastal resilience planning.
Conclusion and Recommendations
This project demonstrates the critical role of GIS-based spatial analysis in emergency management and coastal resilience planning. By modeling historical and future storm surge scenarios, key vulnerabilities in Connecticut’s coastal communities were identified—particularly along the Thames, Niantic, and Connecticut Rivers, which consistently appeared at high risk across multiple events. The shelter accessibility analysis revealed potential service gaps where vulnerable populations may have limited access to safe, elevated facilities during extreme weather events.
Moving forward, emergency managers should consider reevaluating shelter siting, reinforcing and rerouting evacuation infrastructure where necessary, and incorporating public feedback through surveys and interactive mapping tools. Localized data, such as the CDC Social Vulnerability Index, can further guide targeted outreach and resource allocation. Continued investment in updated storm surge modeling and public engagement strategies will be essential to building community resilience and protecting at-risk populations in a changing climate.
References
CIRCA. (2019). Sea Level Rise in Connecticut Final Report. Connecticut Institute for Resilience and Climate Adaptation.
https://circa.uconn.edu/wp-content/uploads/sites/1618/2019/10/Sea-Level-Rise-Connecticut-Final-Report-Feb-2019.pdf
NOAA. (2012). Service Assessment: Hurricane Irene, August 21–30, 2011. National Oceanic and Atmospheric Administration.
https://www.weather.gov/media/publications/assessments/HurricaneIrene11.pdf
NOAA. (2013). Service Assessment: Hurricane/Post-Tropical Cyclone Sandy, October 22–29,
2012. National Oceanic and Atmospheric Administration.
https://www.weather.gov/media/publications/assessments/Sandy13.pdf
NOAA. (2019). The Great New England Hurricane of 1938. National Oceanic and Atmospheric Administration. https://www.weather.gov/okx/1938HurricaneHome